This is one of a series of inter-related articles on learning and training; if interested in this subject, please check other blog posts.
In a previous blog I explained a simple comprehension measurement technique[1].
The technique consists of comparing results from a pre-course test and a post-course test. In the test participants are asked to rank a number of project management activities chronologically, thus giving an important indication of their understanding of the project management process[2].
The answers are then compared to an opinion developed by experts and variance from that is measured. The smaller the variance, the higher the understanding of the process.
Note that the pre-test is completed individually, while the post-test is done as a team (i.e. the team has to agree on a rank).
In the chart below, the results from 3 teams are compared:
- Team 1 has a medium bandwidth of scores on the pre-test (61-105) and a post-test team score of 82.
- Team 2 has a larger bandwidth of scores on the pre-test (88-154) and an excellent post-test team score of 68.
- Team 3 has a narrow bandwidth of scores on the pre-test (72-82) and a post-test team score of 70.

The knowledge test of this group already indicated a substantial increase in knowledge, so this was no longer a variable. The remaining variable was then the fact that the post-tests were done as a team and not as individuals, adding another dimension: that of team dynamics, which of course is determined by the individual personalities and attitudes within the team.
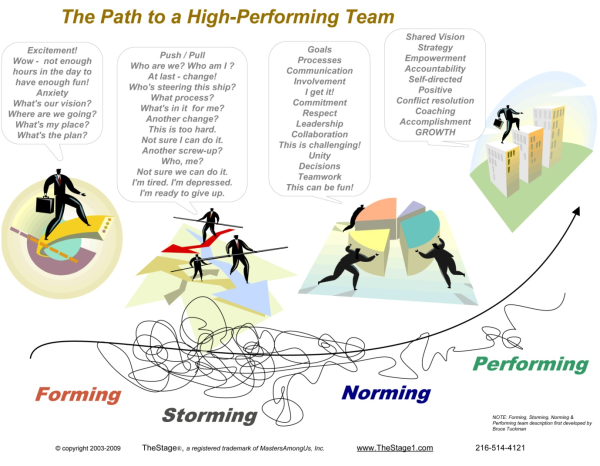
A well know phenomenon in team dynamics is the Forming-Storming-Norming-Performing cycle[3].

Looking back at our team results:
Team 2 represents the trainer’s dream: the high pre-test scores and wide bandwidth indicate a relatively low entry level of comprehension and low level of alignment at the outset[4], with a much improved common level of comprehension at the end. This team score could not have been achieved only by the individual gain in knowledge, but also required an excellent team dynamic.
In other words, the team had reached, if not the performing stage, at least the norming stage where team members had found a role that suited them; and that allowed them to speak freely, resolve conflict collaboratively, and select the best answers for the test irrespective of who suggested it. Such teams conduct dialogues rather than have discussions, remain calm and productive, and give members a sense of purpose.
Team 3 is similar but which much smaller differences. The narrow pre-test score bandwidth indicates higher level of entry comprehension and alignment, probably because team members were more experienced in managing projects. The post-test team score was still marginally better than the best individual score, again indicating team learning.
However, if the pre-test scores were that good and well aligned, could and should they have done better at the post-test?
The answer is yes.
If I remember correctly, this was a senior team and while the result was plausible, personalities were strong and discipline-minded; thus the team dynamic was a lot less conducive to producing the best result possible. They could and should indeed have done better.
Team 1 is the outlier. With a best individual pre-test score of 61 (best of all scores of both pre- and post-tests) and a normal bandwidth, they only managed a post-test score of 82, by far worse than the other teams. Either the 61 score was a fluke, or there was at least one expert in the team who struggled to be heard by his/her teammates. This is not uncommon and may be of interest to team leaders: experts are often introverts who prefer working alone, and they may not possess the best team skills. But a good team will give everyone a change to speak up, and not be dominated by the opinions of the loudest voice.
I cannot remember the specific group but as a trainer we stay receptive for signs of storming or domination by a single team member; and if required we try and mediate to advance the team’s dynamic to the next stage.
Interestingly, the quality of the final presentation, which was the major team output from the course, had a degree of correlation to the results of this ranking exercise, but much less so to the knowledge test results. A great pity that those findings were never captured and are probably forever lost.
To conclude this tri(b)logy, I would like to remind trainers to:
- Make sure clear training objectives are defined and put in the perspective of the organizational learning context;
- Remember that learning outcomes alone are often not the expected end-benefits by the client organization and be clear about that when stating value to clients;
- Identify adequate measuring tools, implement and document them and communicate results;
- Remember that the learning outcomes of a training course are just as much determined by the materials and way of presenting, as by the personalities and team dynamic in the group. As good trainers we need to be aware of this and include measures to guide these, in order to achieve the optimum learning climate and yield the value that’s expected.
[1] See the blog “How to Measure Training Results In Terms of Knowledge & Understanding”
[2] The importance of understanding this process is underlying Rita Mulcahy’s emphasis on the project management process chart. See Rita Mulcahy, PMP: PMP Exam Prep, 7th Ed, 2011, pp 42-57.
[3] While I chose the graphic for its completeness, it does not show the cyclical nature of team dynamics. When certain team members get replaced for instance, the cycle may start over again.
[4] This is an observation, not a judgmental statement.
Tags: team, Project Management Learning, Learning, Human Aspects, Team Dynamic
